Understanding Consumption based Billing
VIDIZMO caters to its customers who are part of VIDIZMO's SaaS by providing Consumption-based billing, also known as Usage-based billing. Organizations are charged per their usage providing transparency and better monitoring of resources to both the customers and the company. Furthermore, the detailed consumption reports can be utilized by Administration to monitor utilization, maintain budgets and overages of the VIDIZMO resources being consumed.
VIDIZMO sets up your billing account at the time of sign up. A billing account aggregates the billing of all portals created in it, and the generated reports are available in Portal Settings.
Refer: Consumption Reports for SaaS Deployment Overview.
Concept
VIDIZMO's consumption model covers several billing dimensions: Processing (measured in Processing Units), Storage (measured in Storage Units), Bandwidth (measured in Bandwidth Units), CALs (user licenses), Portals, and Tokens (measured in Tokens, for AI agent usage in Intelligence Hub). Each dimension is tracked and reported on a dedicated tab in the Consumption Reports dashboard.
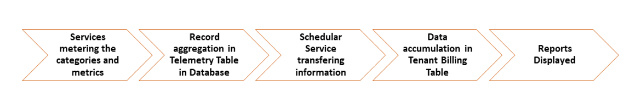
In VIDIZMO, the whole procedure consists of metering and reporting extensively with the implementation of multiple categories, metrics, sources and services. This is executed by services which monitor the resources being consumed in an Account.
Note: By default, consumption reports are generated once per day for each Account. This interval can be configured from the Application Configuration keys. To read more, see How to Update Scheduled Tasks using Application Configuration Keys in VIDIZMO.
Once, all of this is done, VIDIZMO's Billing API is used to display the consumption reports in the Portal Settings.
Telemetry
VIDIZMO's telemetry is the automatic recording and transmission of usage incurred in an Account to the database so that reports can be generated for the consumption. This process includes the services used to meter usage, categories the data is divided into, the associated metrics within each category and the corresponding source of each record.
Service
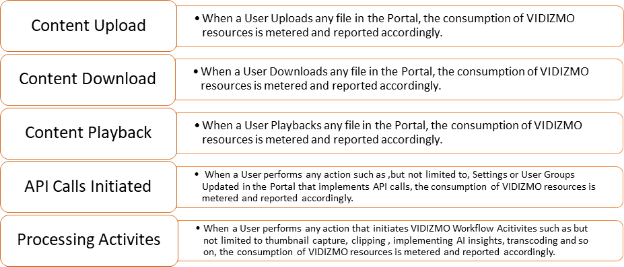
A front-end service records bandwidth consumed while loading static resources, playing back content, and downloading files. This metering takes place every minute for a browser (every 3 seconds in private/incognito mode). A back-end service meters content processing activities (transcription, redaction, OCR, summarization, transcoding, and other AI operations). All API calls are also recorded by this service.
Telemetry categories
The data reported by the services above is organized into the following categories, each corresponding to a tab in the Consumption Reports dashboard:
i. Processing — All content processing activities are tracked here, measured in Processing Units (PU). This includes transcription, translation, summarization, OCR, object detection, PII detection, redaction, embedding, chapters, transcoding, malware scanning, and general workflow processing.
ii. Storage — The amount of space used to store content, measured in Storage Units (SU). Broken down by tier: Hot Storage, Cool Storage, and Archive Storage.
iii. Bandwidth — Data transferred when uploading, playing back, downloading, and loading portal resources, measured in Bandwidth Units (BU).
iv. CALs — Client Access License consumption by type (e.g., Administrator, Power+, Viewer).
v. Portal — The total number of portals in the account.
vi. Tokens — Tokens consumed by AI agents in Intelligence Hub when users interact with the chatbot. Reported as a billable Token Unit, with separate counters for input, output, and total tokens.
Note: Content served from cache is not reported under the Bandwidth category.
Telemetry Metric
The possible counters for the above categories could be of the following, depending on the category being metered.
| Metric counter | Unit | Description |
|---|---|---|
| ProcessingUnit | PU | Unified processing consumption for all AI and workflow activities |
| StorageUnit | SU | Unified storage consumption across all tiers |
| BandwidthUnit | BU | Unified bandwidth consumption for egress and ingress |
| Ingress | Bytes | The size of data uploaded |
| Egress | Bytes | The size of data downloaded or served |
| Computation | Milliseconds | The execution time taken by a process |
| InputContentLength | Milliseconds | The duration of the input content |
| InputContentSize | Bytes | The size of the input content |
| InputNumberOfPages | Count | The number of pages in a document |
| TokenUnit | Token | Unified, billable token consumption for AI agent usage |
| InputTokens | Token | Tokens sent to the AI model as input |
| OutputTokens | Token | Tokens generated by the AI model as output |
| TotalTokens | Token | The combined total of input and output tokens |
Telemetry Source
There can be one of the three sources for all the records that are being accumulated in the database.
| Source | Description |
|---|---|
| API | These are the records aggregated by an API call |
| User | The records aggregated by some action of User that initiates a front-end process |
| Service | These records are aggregated by some action of a User that initiates a back-end process |
Tenant Billing Table
A scheduled service accumulates data from Telemetry and aggregates it into the Tenant Billing table in the database once per day. All the final data including total count of Portals, Storage, Users, Active Users, Contributors, Viewers, Administrators, Managers and Moderators and all other Telemetry data are present in this table in database.
Reporting
An API is used to report data from the tenant billing table to the Consumption Reports so that they are displayed accordingly in the Billing section of an Account. Multiple filters can be applied to get the reports for specific time. Moreover, the following features are available for the reports generated:
- Tabular View
- Graphical View
- Downloadable CSV file
To read more about the consumption reports and their associated features, see Consumption Reports for SaaS Deployment Overview
Use-Cases
A tenant can view the consumption for multiple activities performed within an Account.
Read Next
- Understanding Azure Storage in VIDIZMO
- Consumption Reports for SaaS Deployment Overview
- How to View, Filter and Extract Consumption Reports